Is Maribyrnong a Safe Suburb? How to Read Local Crime Data
Is Maribyrnong a safe suburb? Learn how to read Victoria Police crime data, avoid common traps, and judge street-level risk before you rent or buy.
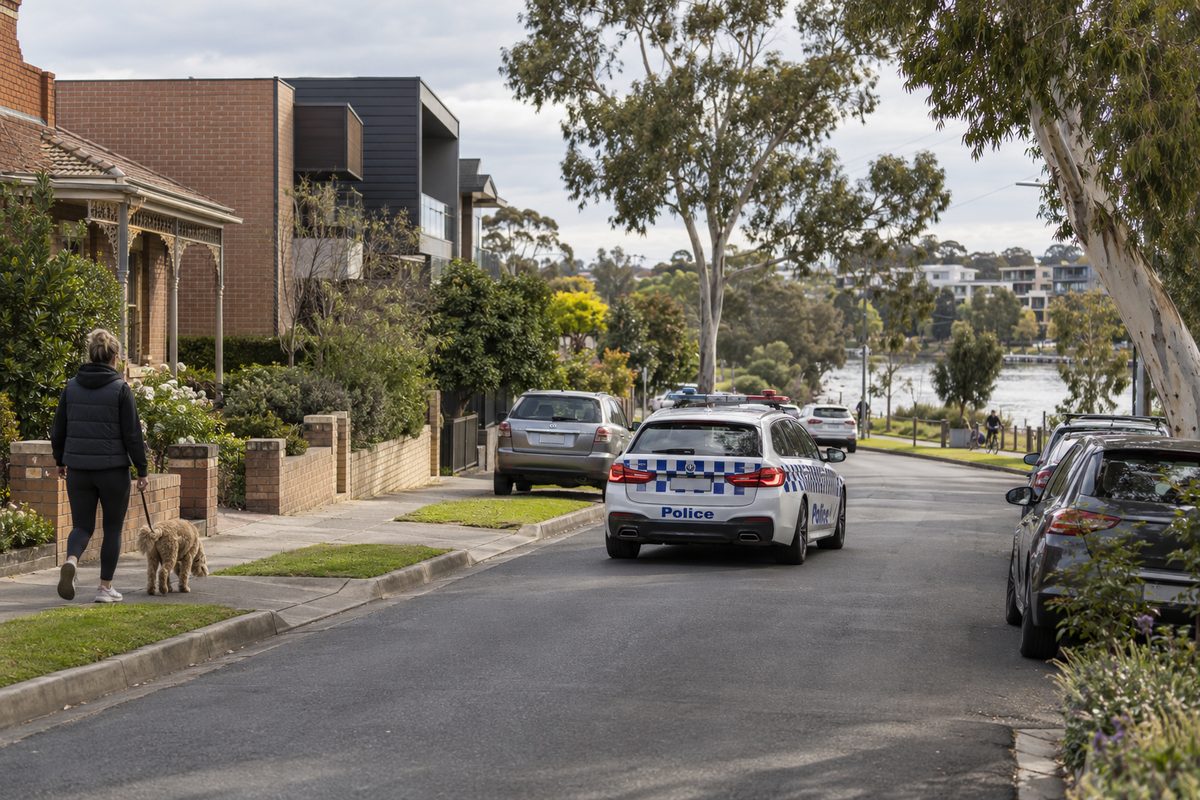
Maribyrnong is a reasonably safe inner-west suburb, with crime levels that look typical for a built-up part of Melbourne rather than unusually high or low. Most of what gets recorded is property crime, and violent crime is a smaller share. But a single verdict hides more than it shows. The real skill is knowing how to read the numbers yourself, because the same figures can look scary or calm depending on how they are cut.
This guide shows you where the data lives, what it counts, where it misleads, and how to turn it into a decision about one street, not a whole postcode.
Where does the official crime data come from?
The main source is Victoria Police. Every offence reported to police is recorded, and the figures are published through the Crime Statistics Agency, an independent body that releases data by suburb, postcode and council area. You can download the tables free and filter by offence type.
Two points matter straight away. The data counts offences that were recorded, not offences that happened. And it counts them by the place the offence occurred, not where the offender or victim lives.
The second point trips people up. A shop theft at a large retail centre is logged against the suburb that holds the centre. It says nothing about the quiet cul-de-sac two streets away.
Which area should you look at: suburb or council?
You will find figures at two levels. The suburb of Maribyrnong is small. The City of Maribyrnong is a much larger council area that also covers Footscray, Braybrook, Maidstone, Avondale Heights and other neighbourhoods.
This is a classic trap. Search for "Maribyrnong crime rate" and you may land on a council-wide number. That number mixes in busier commercial and transport zones. Footscray, Victoria has a dense town centre, a major station and late-night trade, so it generates far more recorded incidents than a residential street by the river. Braybrook, Victoria and Maidstone, Victoria each have their own profile again. Avondale Heights sits further north-west and reads as a quieter, more family-oriented pocket.
The structure of local government in Australia explains why this happens. Councils are drawn for services like rubbish, planning and roads, not to match how crime clusters. A council boundary is an administrative line. Crime does not respect it.
My advice: always start at the suburb table, then compare it with its neighbours one by one. Do not rely on the council figure to describe any single street.
Why is a raw count a poor measure?
A raw count rewards small, empty places and punishes busy ones. A suburb with 20,000 daily visitors will record more incidents than one with 2,000, even if each visitor is equally safe.
That is why good analysis uses a rate, usually offences per 100,000 residents. The rate lets you compare a large area with a small one fairly.
Rates have their own flaw. They divide by residents, but offences happen to visitors, workers and shoppers too. A suburb with a big shopping centre and few homes can show an inflated rate because the denominator is small. The population on paper is not the population on the ground.
When I check a place, I look at both: the count to see the scale, and the rate to see the intensity. If they point in different directions, I dig further before drawing any conclusion.
What does the population base do to the numbers?
Rates depend on how many people live somewhere. The Australian Bureau of Statistics supplies those resident counts through the Census and annual estimates. If the estimate is out of date, the rate is out of date.
Population growth is the quiet distortion here. New apartments have been added in and around the inner west, and more residents mean more people to share the same count. If offences stay flat while the population climbs, the rate falls even though nothing about daily safety changed. If offences rise a little while the population climbs a lot, the rate can still fall.
So when you read a trend line, ask what happened to the denominator. A falling rate may reflect a growing suburb, not a safer one. A rising rate in a suburb that is shrinking is a more worrying sign than the same rise in a booming one.
Which offence types should you separate out?
Never look at the total. Totals blend very different things. A stolen parcel and an assault both count as one offence, but they affect your life in very different ways.
Split the data into these groups:
- Crimes against the person: assault, robbery, sexual offences. These matter most for how safe you feel walking home.
- Property and deception offences: theft from vehicles, burglary, shoplifting, fraud. These drive most of the totals in any urban area.
In suburbs like this one, property crime makes up the bulk of recorded offences. That is normal for a place near major roads, a large retail centre and plenty of parked cars. It tells you to lock your car and bring valuables inside. It does not tell you to avoid the area.
A client of mine once ruled out a street because the suburb total looked high. When we split the data, almost all of it was theft at the shopping precinct. The residential streets she cared about looked ordinary. She moved in and has had no trouble.
How do you read family and domestic offences correctly?
This category needs care. Domestic violence incidents are recorded in the data as family incidents, and they happen behind closed doors. They are not a measure of danger on the street.
A higher number here can also mean something positive. Victoria has worked to encourage reporting, and more reports can reflect greater willingness to call police, not necessarily more incidents. Treat a rise in these figures as a reporting-and-support question first.
For a renter or buyer, this category says very little about whether you will feel safe in a given suburb. Read it for context about community services, not as a warning label on a neighbourhood.
Which crimes tell you the most about daily life?
Pick the offences that match how you live. A cyclist should weigh bicycle theft heavily. A commuter who parks on the street should weigh theft from motor vehicles. A night-shift worker should weigh offences in public places after dark.
Bicycle theft is a good example of a number that looks bigger than it feels. Bikes are stolen from stations, shopping centres and apartment car parks everywhere in inner Melbourne. If you ride the Maribyrnong River Trail or commute toward the Melbourne central business district, the risk is mostly about where you lock up and how. A good lock and a secure storage spot cut most of that risk. It is a habit problem more than a suburb problem.
What I found was that people who ride often tend to worry about assault on the path, when the recorded risk is mostly about the bike itself. Match your worry to the data.
Do parks, trails and open space change the picture?
Yes, but in both directions. The Maribyrnong River and its paths are a big reason people want to live here. Open, well-used paths with other walkers and riders on them tend to feel safe. The same path late at night with poor lighting feels different.
The data will not show you lighting or foot traffic. You need to visit. Walk the route you would actually use, at the hour you would actually use it. Notice whether the path is visible from nearby homes, whether there are lights, and whether other people are around.
Large redevelopment sites also change the feel of an area over time. The Maribyrnong Defence Site is a former defence property that is being turned into housing and public space. Construction zones can be quiet and isolated while work is under way, and busier and better lit once residents arrive. Check the current status of any site near the property you are considering, because the answer will change from year to year.
How do you compare Maribyrnong with its neighbours fairly?
Build a small table yourself. Put five suburbs in rows and four offence groups in columns, and fill in the rate per 100,000 for the latest full year. Include Maribyrnong, Footscray, Braybrook, Maidstone and Avondale Heights.
Then check two things. First, are the differences large or tiny? A gap of a few percent is noise. A gap of fifty percent is worth noting. Second, what is each suburb built around? A suburb with a train station, a high street and nightlife will always rank above a purely residential one. That is a function of use, not of how safe residents feel.
When we did this exercise for a couple choosing between two inner-west suburbs, the one with the scarier headline number turned out to have a lower rate of crimes against the person. The headline came from a single busy retail precinct. They chose it and were happier for it.
How many years of data should you use?
Use at least three, and five if you can. One year is easy to distort. A single burst of vehicle theft, a change in how police record an offence, or a pandemic lockdown can shift one year and mislead you.
Lockdown years in particular are unreliable. Fewer people were out, so some offences dropped sharply and then bounced back. If your window includes those years, compare against pre-lockdown and post-lockdown periods separately.
Look at the direction of the line, not one point on it. A suburb that is slowly improving is often a better bet than one with a lower number that is climbing.
What can the data never tell you?
Quite a lot. It cannot show unreported crime, which is common for minor theft and some personal offences. It cannot show how a street feels at ten at night. It cannot show whether neighbours know each other, or whether the council fixes broken lights quickly.
That is why I treat the numbers as a filter, not a verdict. They help you rule out places with a clear problem and narrow your shortlist. Then your own eyes do the final work.
One of my clients tried to settle the question using only the spreadsheet and kept going in circles. The moment she spent a Thursday evening walking the streets, she made her decision in an hour. The data got her to the right three streets. The walk told her which one.
How do you check a specific street?
Work from the outside in. Start with the suburb data, then talk to people and look closely at the block.
- Visit at two times: once on a weekday afternoon and once on a weekend night. The street can look like two different places.
- Look for signs of care: tidy fences, working street lights, cars parked in driveways, lots of people out walking.
- Ask neighbours: a two-minute chat at the letterbox tells you more than a year of tables.
- Check parking and storage: secure garages and lockable bike storage cut the most common risks.
If you are buying, ask the agent about recent break-ins on the street. If you are renting, ask the current tenants. Most people will answer plainly.
So what is the honest answer for you?
If you are a typical resident who locks the car, secures the bike and uses normal common sense, Maribyrnong is a comfortable place to live. The recorded risks are mostly about property, and they are manageable with simple habits. The suburb is not free of crime, and no Melbourne suburb is.
If you have a specific concern, such as late-night travel on foot or a ground-floor flat, test that concern directly with the offence type and the location that match it. That is where the real answer sits.
What should you do next?
- Download the latest suburb table from the Crime Statistics Agency and filter it to the last three to five years.
- Split the offences into crimes against the person and property crime, and ignore the grand total.
- Compare rates per 100,000 for Maribyrnong against Footscray, Braybrook, Maidstone and Avondale Heights.
- Walk your intended street on a weekday afternoon and a weekend night, and talk to one neighbour.
- Set up the basics on day one: a quality bike lock, a secure place to park, and nothing valuable left in the car.
Do those five things and you will know more about the safety of your chosen street than any headline can tell you.